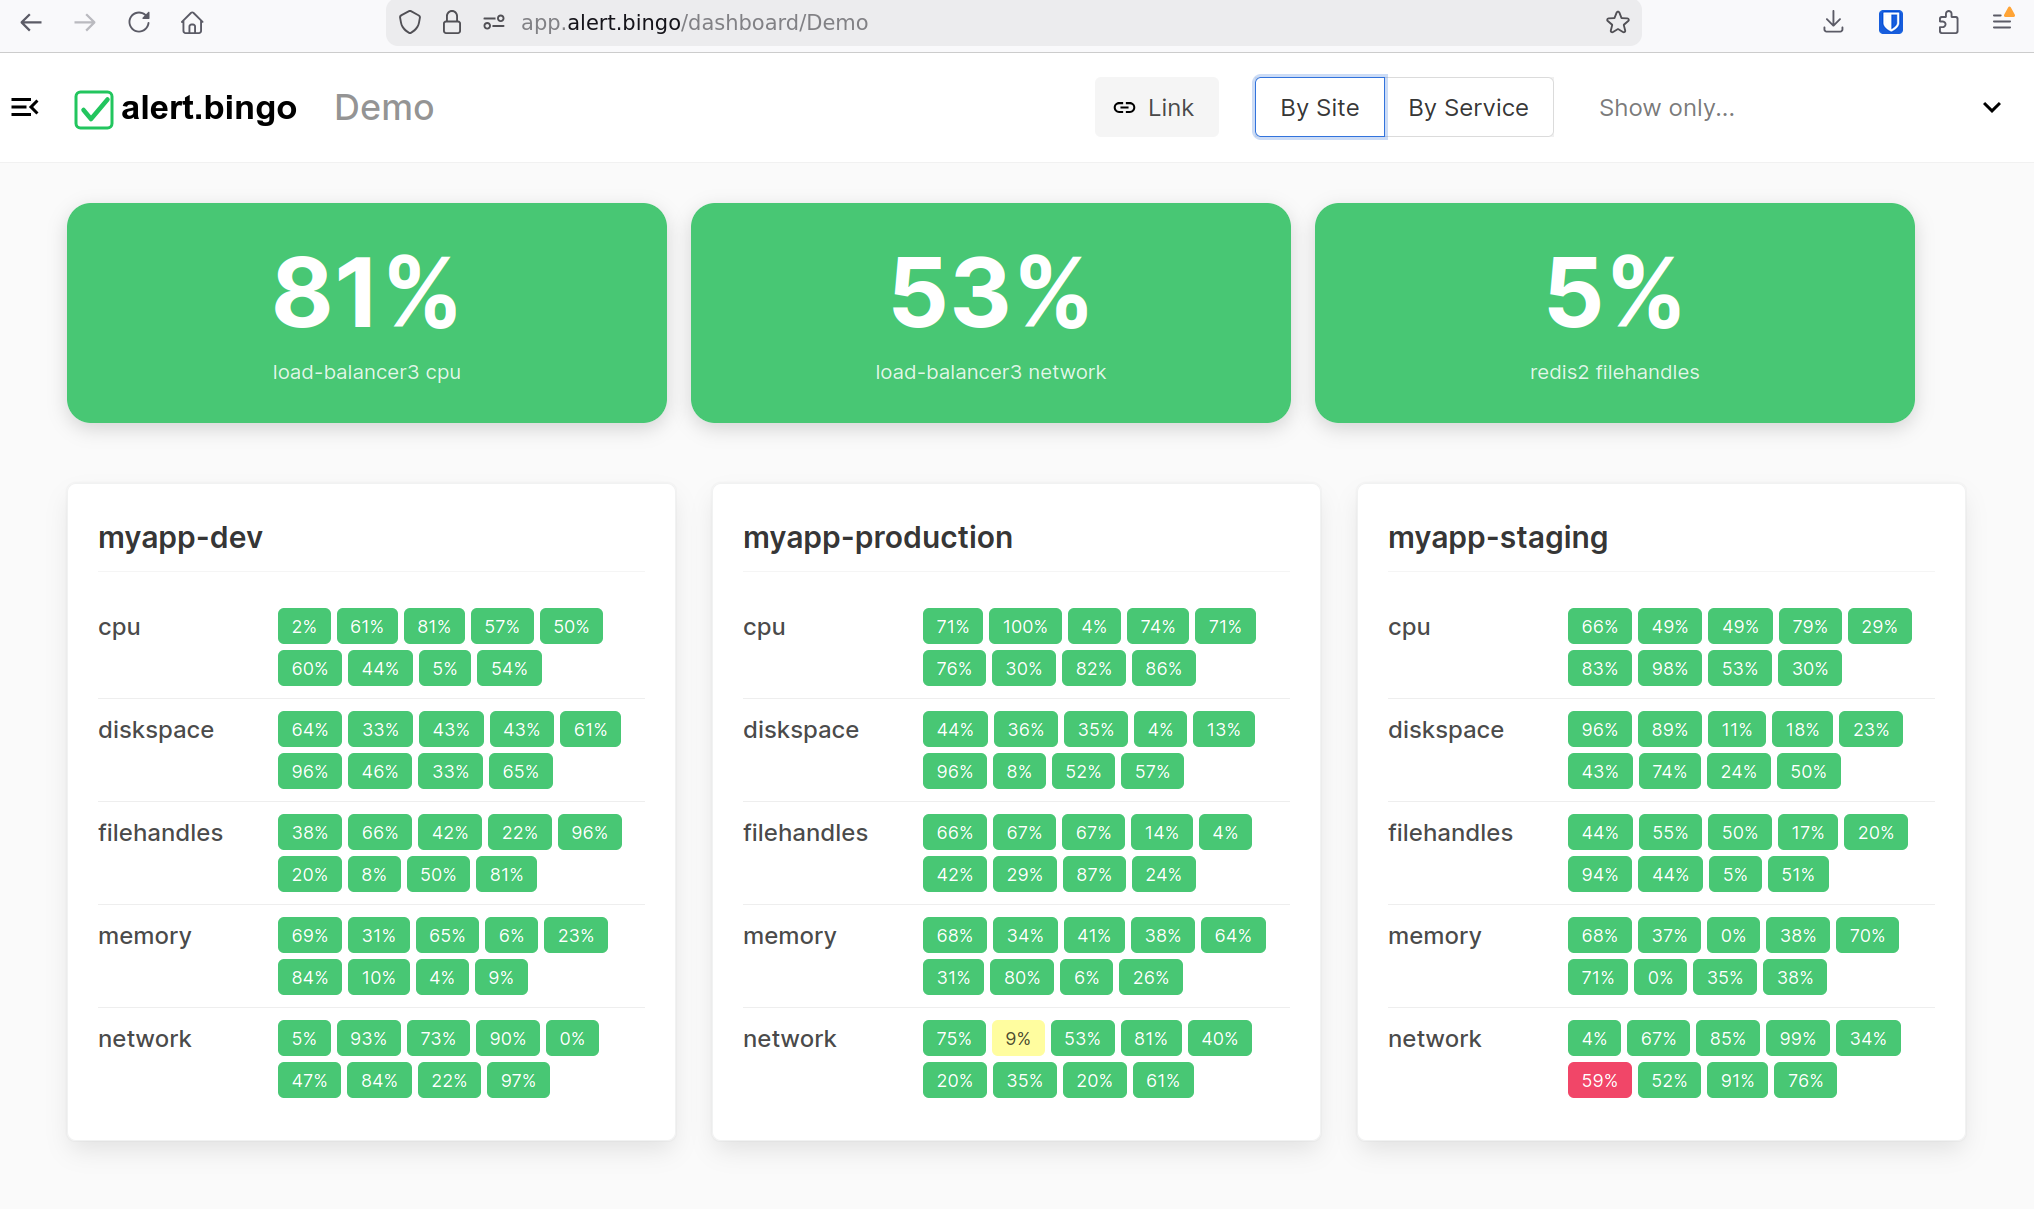
A single-view dashboard for every screen — phone, laptop, or TV. See all your metrics and alerts at a glance. If everything's green, you're winning.
Get Started — it's free
Tiny color-coded tiles — green, yellow, red — arranged like a bingo card. At a glance from any distance, you know if something needs attention.
Stick it on a TV across the room. If everything's green, keep doing what you're doing. A flash of red? Time to look closer.
No YAML files. No UI wizards. Just POST an HTTP request and the tile appears. Your infrastructure code is your config.
Generate a shareable link — no login needed. Send it to a TV, share with colleagues, or embed it in your internal wiki.
Fully responsive from phone to ultrawide. The dashboard adapts its layout so tiles are always readable.
Make a new metric every time you think of something you want to track, no matter how small.
Promote important checks into large hero tiles at the top of the dashboard. CPU at 81%? Make it impossible to miss.
Configuration is entirely client-side. Send a check from a cron job, a deploy script, or directly from your application — any language, any platform.
POST JSON to the API with your dashboard name, site, service, and check name. The tile is created automatically.
0 = green (OK), 1 = yellow (warning), 2 = red (alert). The tile lights up accordingly.
Use inactive_escalate to auto-alert when a check stops reporting, and inactive_expire to clean it up later.
Set highlighted to a display name and the check gets a large hero tile at the top of the dashboard.
| Field | Required | Description |
|---|---|---|
dashboard | Yes | Dashboard to place the check on |
site | Yes | Logical grouping, e.g. myapp-prod |
service | Yes | Service category, e.g. postgres, cpu |
name | Yes | Unique check name within its service |
alert_level | Yes | 0 = OK, 1 = Warning, 2 = Alert |
value | No | Short-form status shown on the tile, e.g. 42% |
message | No | Long-form status shown on hover / detail view |
inactive_expire | No | Remove tile after this duration of silence, e.g. 48h |
inactive_escalate | No | Auto-escalate to red after this duration of silence, e.g. 1h |
highlighted | No | Set a display name to show as a large hero tile (empty = not highlighted) |
Don't want to write curl commands? The alertbingo CLI lets you send checks from your terminal — plus a built-in hoststats mode that continuously reports disk, CPU, RAM and uptime metrics to your dashboard.
Use the CLI to post checks to your dashboard with simple flags instead of hand-crafting HTTP requests. Same API, friendlier interface.
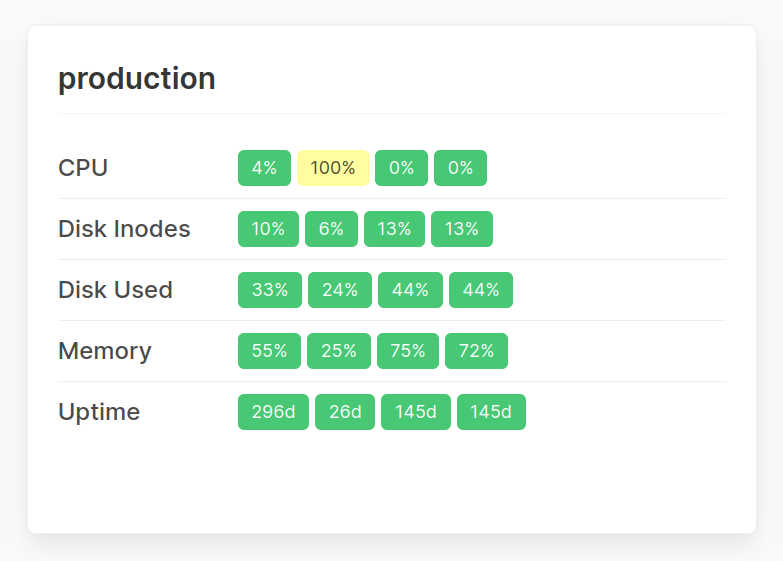
hoststatsRun alertbingo hoststats to automatically report disk usage, CPU load, RAM consumption and uptime. Tiles light up yellow or red when thresholds are breached.
Grab the CLI from github.com/alertbingo/alertbingo and follow the README to connect it to your dashboard.
Here's what's cooking next.
Pipe alerts straight to Slack, Telegram, or literally any URL you fancy.
Coming soonOne endpoint to rule them all. Ping your entire dashboard from Pingdom, UptimeRobot, or whatever you're into — if even one tile goes red, you'll know about it.
Coming soonDig through detailed logs of past events and alert triggers, see exactly what happened, when it happened, and what caused the drama.
Coming soonStart free. Upgrade when you need more dashboards.
Here are the first impressions from friends of the author.
"COOL!"— Michael
"BRILLIANT."— David
"oh man I love this!!"— Zac
"Wow, very nice!"— Drew
"really nice"— Marcello